Case Studies
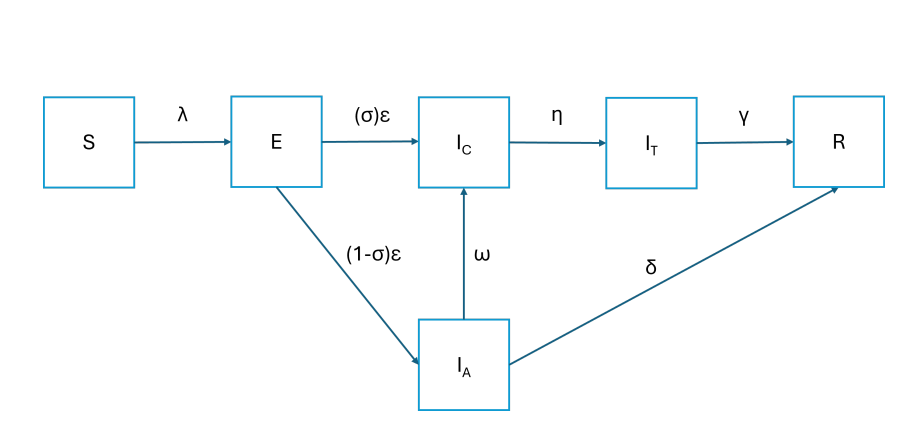
Infectious Disease Modeling
This is a mathematical simulations to predict pathogen spread and evaluate control strategies.
Tools: R and RStudio
SQL Reporting Pipeline
Automated data cleaning and KPI generation system.
Tools: MSSQL, MySQL, PostgreSQL
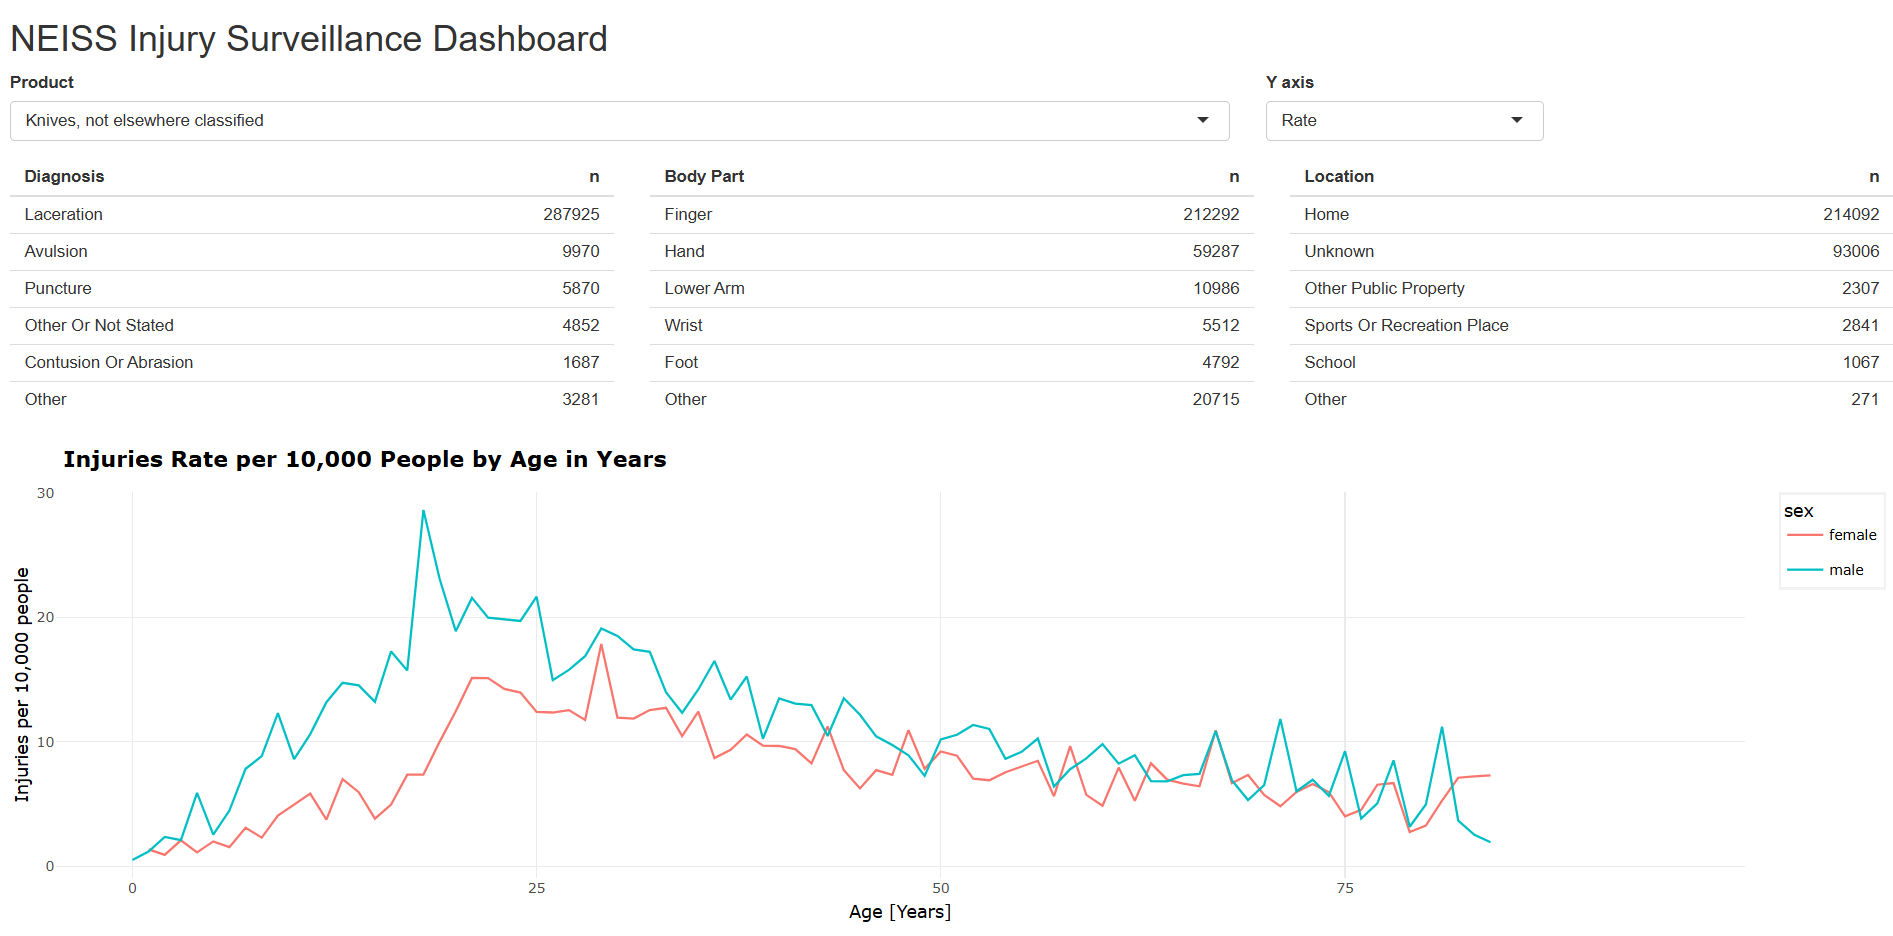
NEISS Injury Surveillance Dashboard
An interactive R Shiny–based injury surveillance dashboard that transforms NEISS data into dynamic visualizations and actionable insights on injury patterns, trends, causes, diagnoses, and affected populations to support evidence-based public health decision-making.
Tools: R, R-shiny